Storage Benchmark Reproducibility and Confound Control
Most storage benchmarks measure systems that don't exist in production.
Most storage benchmark numbers describe a system that does not exist in production. A survey of 415 file system and storage benchmarks pulled from 106 recent papers found that the popular benchmarks people cite are flawed in ways that hide true performance. Three mistakes keep recurring: tests run on storage systems that start out empty, cache state that nobody bothers to record, and trace-replay setups that end up running a workload different from the one they claim to replay. None of this would matter much if storage were cheap to get wrong, and it is not. At the scale of today's AI training clusters, with hundreds of thousands of accelerators pulling data at once, a GPU sitting idle because data hasn't arrived yet is burning money every second it waits<sup>1</sup><sup>2</sup>. Jack Dongarra, University Distinguished Professor Emeritus at the University of Tennessee and Distinguished Research Staff at Oak Ridge National Laboratory, said in his ISC26 closing keynote that the world's top supercomputers routinely hit only a small fraction of their theoretical peak performance, and the reason comes down to data movement getting in the way of processing. A misleading benchmark used to be an academic inconvenience. Now it's a line item.
How empty-system testing and fill level distort throughput numbers
Testing a storage system while it's empty is a bit like judging a restaurant by how fast it serves food at 10 a.m. before any customers show up. The numbers look great and mean almost nothing, because fill level changes the physical reality of how data sits on disk and how the system manages space around it. Most benchmarks start from empty because empty is convenient and fast to set up, but no production system runs that way for long, and the gap between empty and full is exactly where throughput problems hide. On spinning disks or flash drives that are nearly full, free space gets scattered, so a write that looks sequential on paper turns into a string of seeks in practice. Object storage has its own version of the problem: fill level affects how data spreads across shards and where hot spots form, and a lightly loaded bucket never reveals the rate-limit pressure that appears once real traffic and real fill levels are in place.
CoreWeave's benchmark on a 64-node H200 GPU cluster is a good example of taking fill level and system design seriously. The test kept storage traffic separate from the NVIDIA Quantum-2 InfiniBand fabric that handles inter-GPU communication, a separation most published benchmarks skip entirely, and it ran against a per-node throughput target that reflected realistic production fill. The result: 7.94 GiB/s per node against a target of 8 GiB/s, close enough to call the target met, and honest about the conditions it was met under.
Some will argue the fix is simpler: just report the fill level and let readers do the math themselves. That doesn't hold up, because fill-level effects aren't linear and they don't transfer cleanly from one system to another. A reader can't reverse-engineer a fragmentation pattern from a footnote. The test has to run at a fill level that looks like production in the first place, or the number it produces describes a system nobody will ever actually operate.
Why uncontrolled OS page-cache state causes variance between lab and production
If there's one single habit responsible for most of the gap between a benchmark slide and what a system does in production, it's an uncontrolled OS page cache. A warm cache makes any storage system look fast, because the request never actually touches the disk, it's served straight out of memory. Most benchmark reports never say whether the cache was warm or cold when the test ran. The headline number might be measuring RAM speed wearing a storage system's name tag.
Researchers have started building tools to address this, not just adding disclaimers about it. 2DIO, presented at EuroSys '26 in Edinburgh, was built specifically to generate traces that behave like real cache access instead of the smooth, well-mannered curves that older tools produce. Existing trace generators tend to produce concave hit-ratio curves, the kind that climb steadily and predictably. Real workloads don't do that. They produce performance cliffs, where a cache that's working fine suddenly falls off a ledge, and plateaus, where performance stays flat no matter how much you throw at it. 2DIO encodes a workload using a compact set of three parameters that capture both short-term recency (what you touched a second ago) and long-term frequency (what you touch repeatedly over time). Those parameters travel well: scale the system up or down, and the trace's size and length scale along with it, while the underlying cache behavior stays consistent.
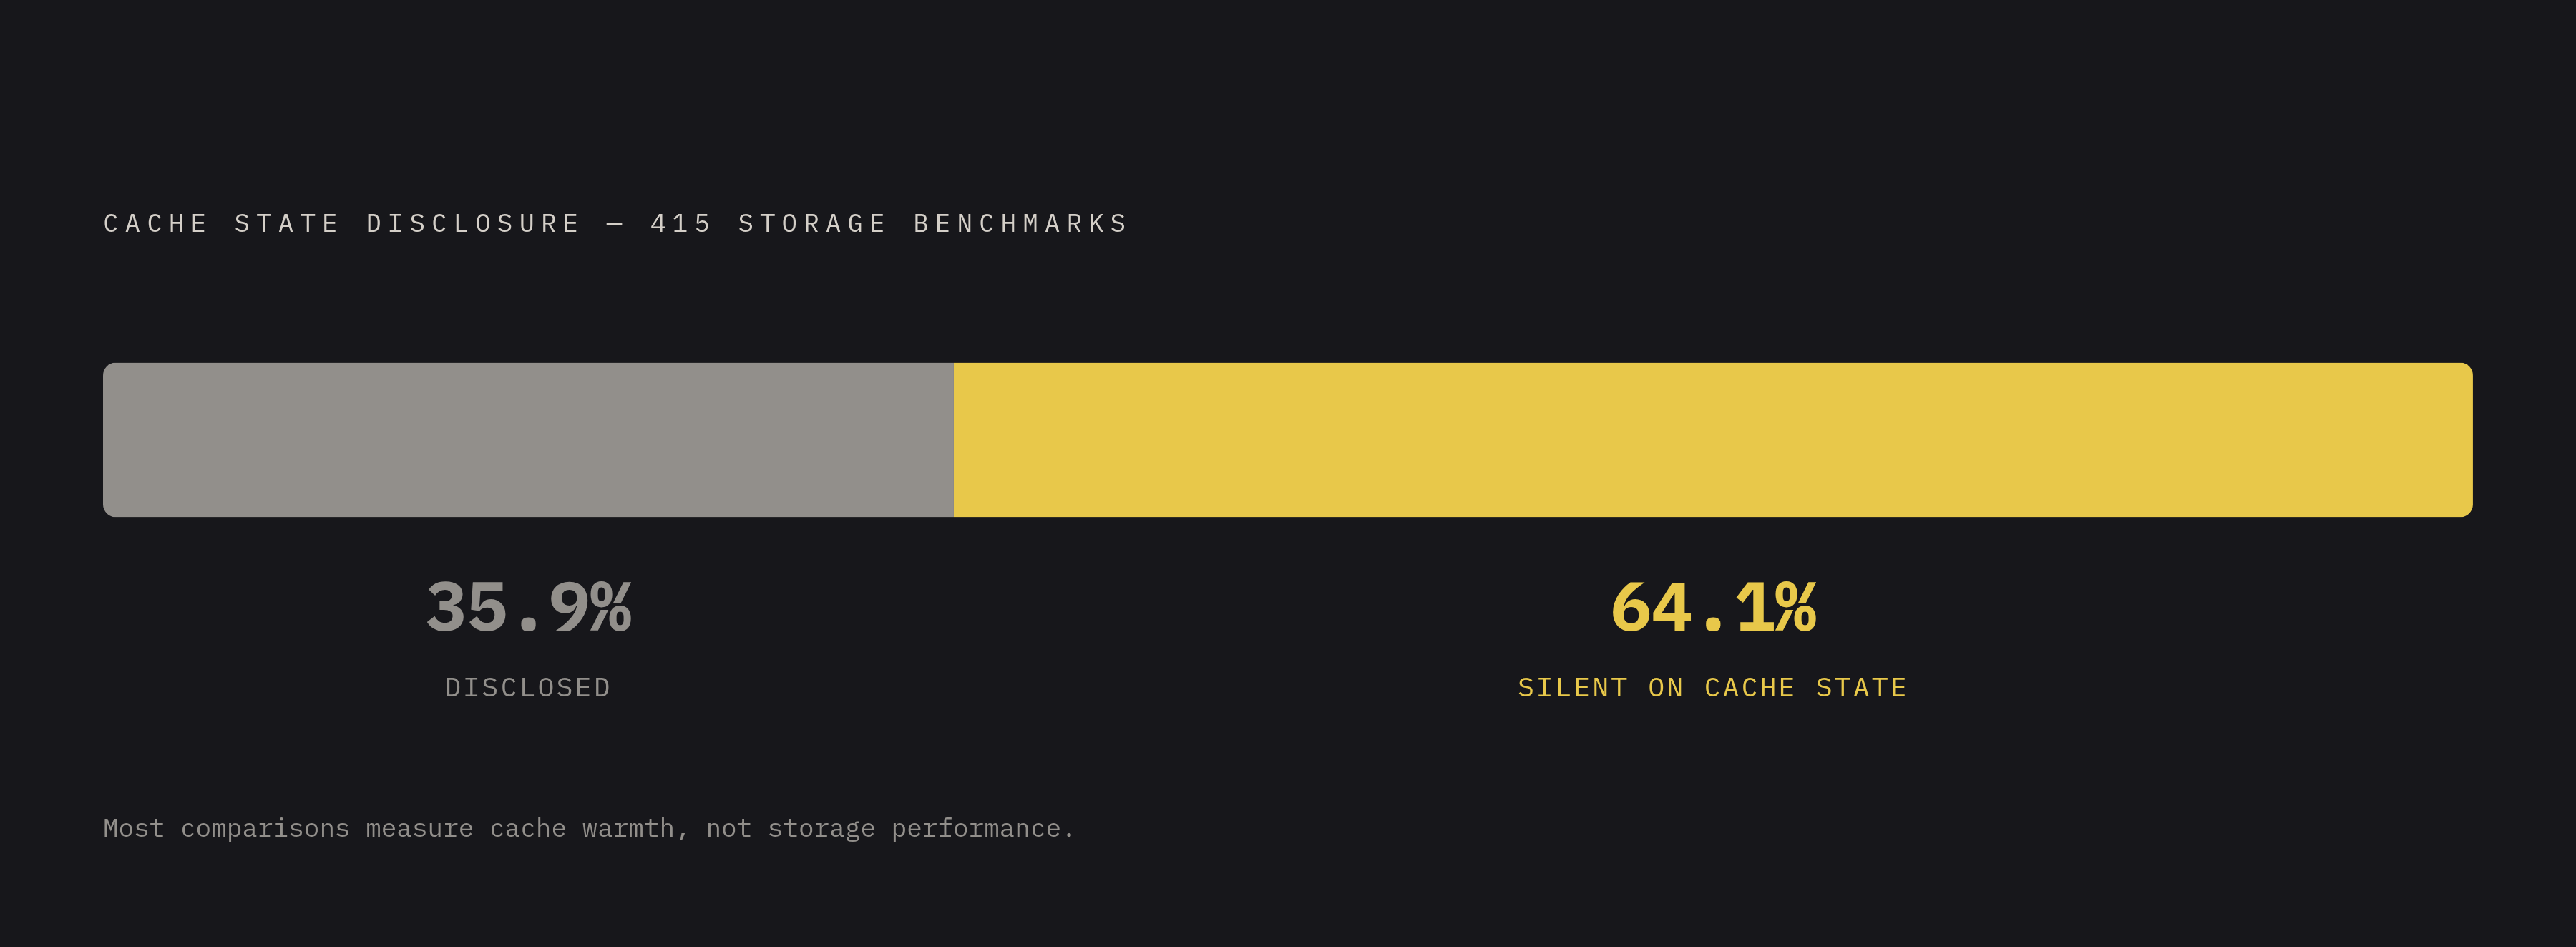
The hit-ratio curve by itself still isn't enough to trust a benchmark. Tools like fio offer frequency-skew models such as Zipf, Pareto, and Zoned, which shape how often different pieces of data get hit, and those models do shift the hit-ratio curve around. 2DIO's own evaluation shows that's still far short of reproducing what real workloads actually look like on a cache. A survey of 415 benchmarks found that only 35.9% of papers said anything about cache state when they ran their tests. That means most published storage comparisons are, functionally, comparing how warm two different caches happened to be, not how two storage systems actually perform.
How synthetic workloads diverge from real ML I/O patterns
Synthetic workloads and simple trace replay share a blind spot: neither one reproduces the lopsided way that real machine learning training actually hits storage. ML I/O follows an extreme power law, where a small slice of files accounts for most of the bytes moved, and a benchmark built on uniform, evenly spread access patterns never sees that concentration. That gap causes two mistakes at once: it underestimates how much pressure builds up on the hot files everyone keeps hitting, and it overestimates how evenly the system is handling load, because evenly spread synthetic traffic is easy to serve.
NIO Bench measured what real ML training I/O looks like by combining two layers of tracing: Python-level hooks that capture what phase of training is happening, and Linux strace underneath to catch every system call, including the ones coming from DataLoader worker subprocesses that spin off in the background. Running this against six ML models on a Nautilus Kubernetes cluster backed by a Ceph distributed file system turned up something that should reset how people think about ML storage benchmarks: the I/O load concentrates in data preparation, model loading, and checkpointing. Not the training loop. A benchmark that only measures training-loop throughput is measuring the part of the job that's mostly compute-bound, while the actual storage bottlenecks sit somewhere else.
Trace replay, the practice of recording real I/O operations and playing them back later, has its own version of this problem. A recorded trace captures what operations happened, but it doesn't capture the DataLoader's concurrency at the time, how deep the prefetch buffer was, or the timing relationship between preprocessing finishing and the GPU asking for more data. Replay it later and you get the same sequence of reads and writes, stripped of the timing pressure that made them hard to serve originally.
This is why ML training I/O needs two separate benchmark axes. Data loading looks like small, random reads following that power-law pattern. Checkpointing looks like large, sequential writes that happen in bursts. Collapse both into a single aggregate number and the result hides which one is actually the bottleneck choking a given training run.
What MLPerf Storage v2.0 added
MLCommons announced results for MLPerf Storage v2.0 in August 2025, and the suite remains the closest thing the industry has to a shared, architecture-neutral way to measure storage performance for ML workloads. The headline addition in v2.0 is real progress: checkpoint I/O is now a first-class part of the benchmark, not an afterthought. That matters because as clusters scale past a hundred thousand accelerators, failures stop being rare events and start happening often enough that checkpoint bandwidth determines how much useful training time a cluster actually delivers<sup>1</sup><sup>2</sup>. IBM's Storage Scale submission in the v2.0 round posted 656.7 GiB/s read bandwidth and 412.6 GiB/s write bandwidth, and for the Llama 3.1 1T model, checkpoint load took about 23 seconds, with save taking somewhat longer. Across the board, systems tested in v2.0 served roughly twice the number of simulated accelerators compared to the v1.0 round, tracking how fast clusters themselves have grown.
Credit where it's due: this is a meaningful step forward for an industry that badly needed one. But the suite still relies on simulated accelerators, and that simulation has a specific, narrow gap. MLPerf Storage requires its simulated accelerators to hit a required utilization level, which is a reasonable design choice for a standardized test. What it doesn't do is reproduce real DataLoader concurrency, real prefetch depth, or the power-law file-access pattern that NIO Bench measured in actual production training jobs. That gap has a concrete consequence: a storage system can clear MLPerf Storage certification and still fail to sustain checkpoint writes for a specific large-model training run, because enterprise storage tuned for small, random-access workloads often can't sustain the sequential terabyte-scale writes a checkpoint demands, even while it clears a throughput-per-simulated-accelerator bar on paper. MLPerf Storage v2.0 is necessary. It's not sufficient on its own to predict whether a given system will keep a given cluster's GPUs fed.
How object storage layout and geography introduce confounds across regions
Cloud object storage adds two more variables that most benchmarks quietly fix in place instead of testing: how data gets laid out, and where in the world the test client sits. Both can flip a vendor ranking on their own.
Each storage layout runs into a different bottleneck: one style (L1) is limited by per-request latency, another (L2) by network bandwidth, and a third (L3) by available memory. A benchmark that reports only aggregate throughput ends up favoring whichever layout happens to match the bottleneck built into the test setup, not the layout that would actually serve the buyer's real workload best. LayoutBench also found that data transfer makes up most of the total cost in its results, so any cost comparison that leaves transfer volume out of the picture is only looking at a slice of the real bill.
Geography plays a similar trick. Backblaze ran a cross-vendor benchmark in the first quarter of 2026 testing Backblaze B2, AWS S3, Cloudflare R2, and Wasabi Object Storage, across both US-East and EU-Central regions. Adding the EU-Central region changed the provider rankings compared to US-East alone: a benchmark run only from a US vantage point would have pointed a European deployment toward the wrong vendor. Backblaze also disclosed its own test constraints openly: a 10 MiB ceiling on file size for average upload and download tests, due to timeout limits; a fixed origination point in the NY/NJ area for US-East tests; and the chance that repeated download tests hit intermediate caching along the way. Naming those constraints openly is unusual and is the right way to publish a benchmark, since most reports leave exactly this kind of detail out.
Geographic asymmetry reflects how CDN routing, network peering, and regional capacity differ from place to place, a structural fact about the internet. Controlling for it means running the benchmark from the same geographic origin as the production workload it's meant to predict, not from wherever the test happened to be easiest to run.
The methodology choices that make a storage benchmark hold up
Every confound named so far has a known fix that just takes the discipline to do by default. Cache state should be flushed between runs, and whether it was flushed should be stated in the results; where a device-level cache is involved, its size and whether it started warm or cold deserve the same disclosure, and tools like 2DIO can generate traces that reproduce a workload's real hit-ratio curve instead of assuming the smooth, concave shape older tools default to. System fill level needs to be set to a representative fraction of capacity before testing even starts, and that fill level needs to be reported alongside the results; for object storage specifically, that means pre-populating buckets with a realistic mix of object sizes and counts. Workload fidelity means splitting ML benchmarks into their two real axes, small random reads during data loading that follow a power-law access pattern, and large sequential bursts during checkpointing, and reporting each one on its own rather than folding them into a single throughput figure that can't actually inform a procurement decision. And checkpoint I/O needs to be treated as a required measurement, not an optional extra, because at the scale modern training clusters now run at, a system that handles training-data throughput fine but can't sustain checkpoint writes is not a system anyone can afford to deploy.
None of these fixes are secret. They show up, in pieces, across the research and the vendor disclosures already covered here, from 2DIO's cache modeling to NIO Bench's phase-level tracing to Backblaze's willingness to list its own test's limitations in public. What's missing is the habit of doing this every time, by default, before the first number ever makes it onto a slide.