Cache Hit Rate Measurement and Optimization in Tiered Storage Systems
Measure cache hits by tier, cost, and time to stop hiding the latency that matters.

Cache hit rate tells you what fraction of requests get answered by the cache instead of traveling all the way back to persistent storage. A hit at the fastest tier beats a hit one level down, and both beat a miss that has to pull from disk or object storage. That ordering is the whole story: modern GPUs chew through data at a pace that network-attached storage simply can't match, orders of magnitude apart, and the cache is the bridge trying to close that gap. Hit rate is the number that tells you whether the bridge is holding weight or buckling under it.
Throughput numbers lie by omission. A system can post great aggregate throughput on a dashboard while the GPU sits idle waiting on a cold read, because averages smooth over the moments that actually hurt. Hit rate doesn't let that failure hide. It appears directly in the ratio, because a miss is a miss whether or not the rest of the system looked busy at the time.
This matters at every layer of a storage stack, not just one. GPU high-bandwidth memory, system memory, local NVMe, object storage: each boundary between these tiers has its own hit rate, and each one either helps or hurts the whole chain. The aggregate behavior of the system depends on how well each individual boundary performs, and that's the reason this metric deserves more attention than it usually gets. It sounds like a simple percentage. Getting that percentage right, and reading it correctly, turns out to be a lot harder than it looks.
How hit rate is commonly measured wrong
A number labeled "hit rate" on a vendor dashboard and the number that actually describes how your application experiences latency are often two different things, and treating them as the same one leads teams to tune the wrong knob.
Start with what gets counted. Some dashboards count every lookup against the cache as a chance at a hit, including cheap metadata probes and prefetch speculations that never cost the application anything either way. If you stack enough of those into the denominator, the reported hit rate looks better than what users actually feel.
Size matters too, and most aggregate numbers flatten it out. A system might hit the large majority of the time on small, cheap objects and only a small fraction of the time on large, expensive ones, and if you average those together you get a number that says everything is fine while the costly misses quietly dominate total latency. A trustworthy hit rate has to be weighted by the cost of a miss, not just counted by how often one happens.
Layered systems add another wrinkle. In a setup with local NVMe as a first tier and object storage as a second, a request that misses NVMe but gets caught by the object storage tier before ever touching true persistent storage might get logged as an aggregate "hit." It still cost real latency to retrieve. If a tier doesn't get its own counter, its own miss rate, its own accounting, the aggregate number hides exactly the delays you're trying to find.
None of this works from a single snapshot. Researchers studying the XRootD caching system used in high-energy physics built a cache simulator from roughly nine months of daily log files, from January through September of 2021, so they could see how data actually got accessed over time. A trustworthy hit rate comes from separate counters per tier, miss penalties weighted by cost, a windowed view instead of a lifetime average, and workloads segmented by the kind of access pattern producing them. Skip any one of those four and the number you're staring at is just decoration.
Working set size as the foundational variable, why capacity sets the ceiling
Before eviction policy, before prefetching, before any clever tuning, there's a hard ceiling on hit rate set by one ratio: how big is the cache compared to the data actually being used right now. That active set is the working set, and it's almost always far smaller than the total dataset sitting in storage.
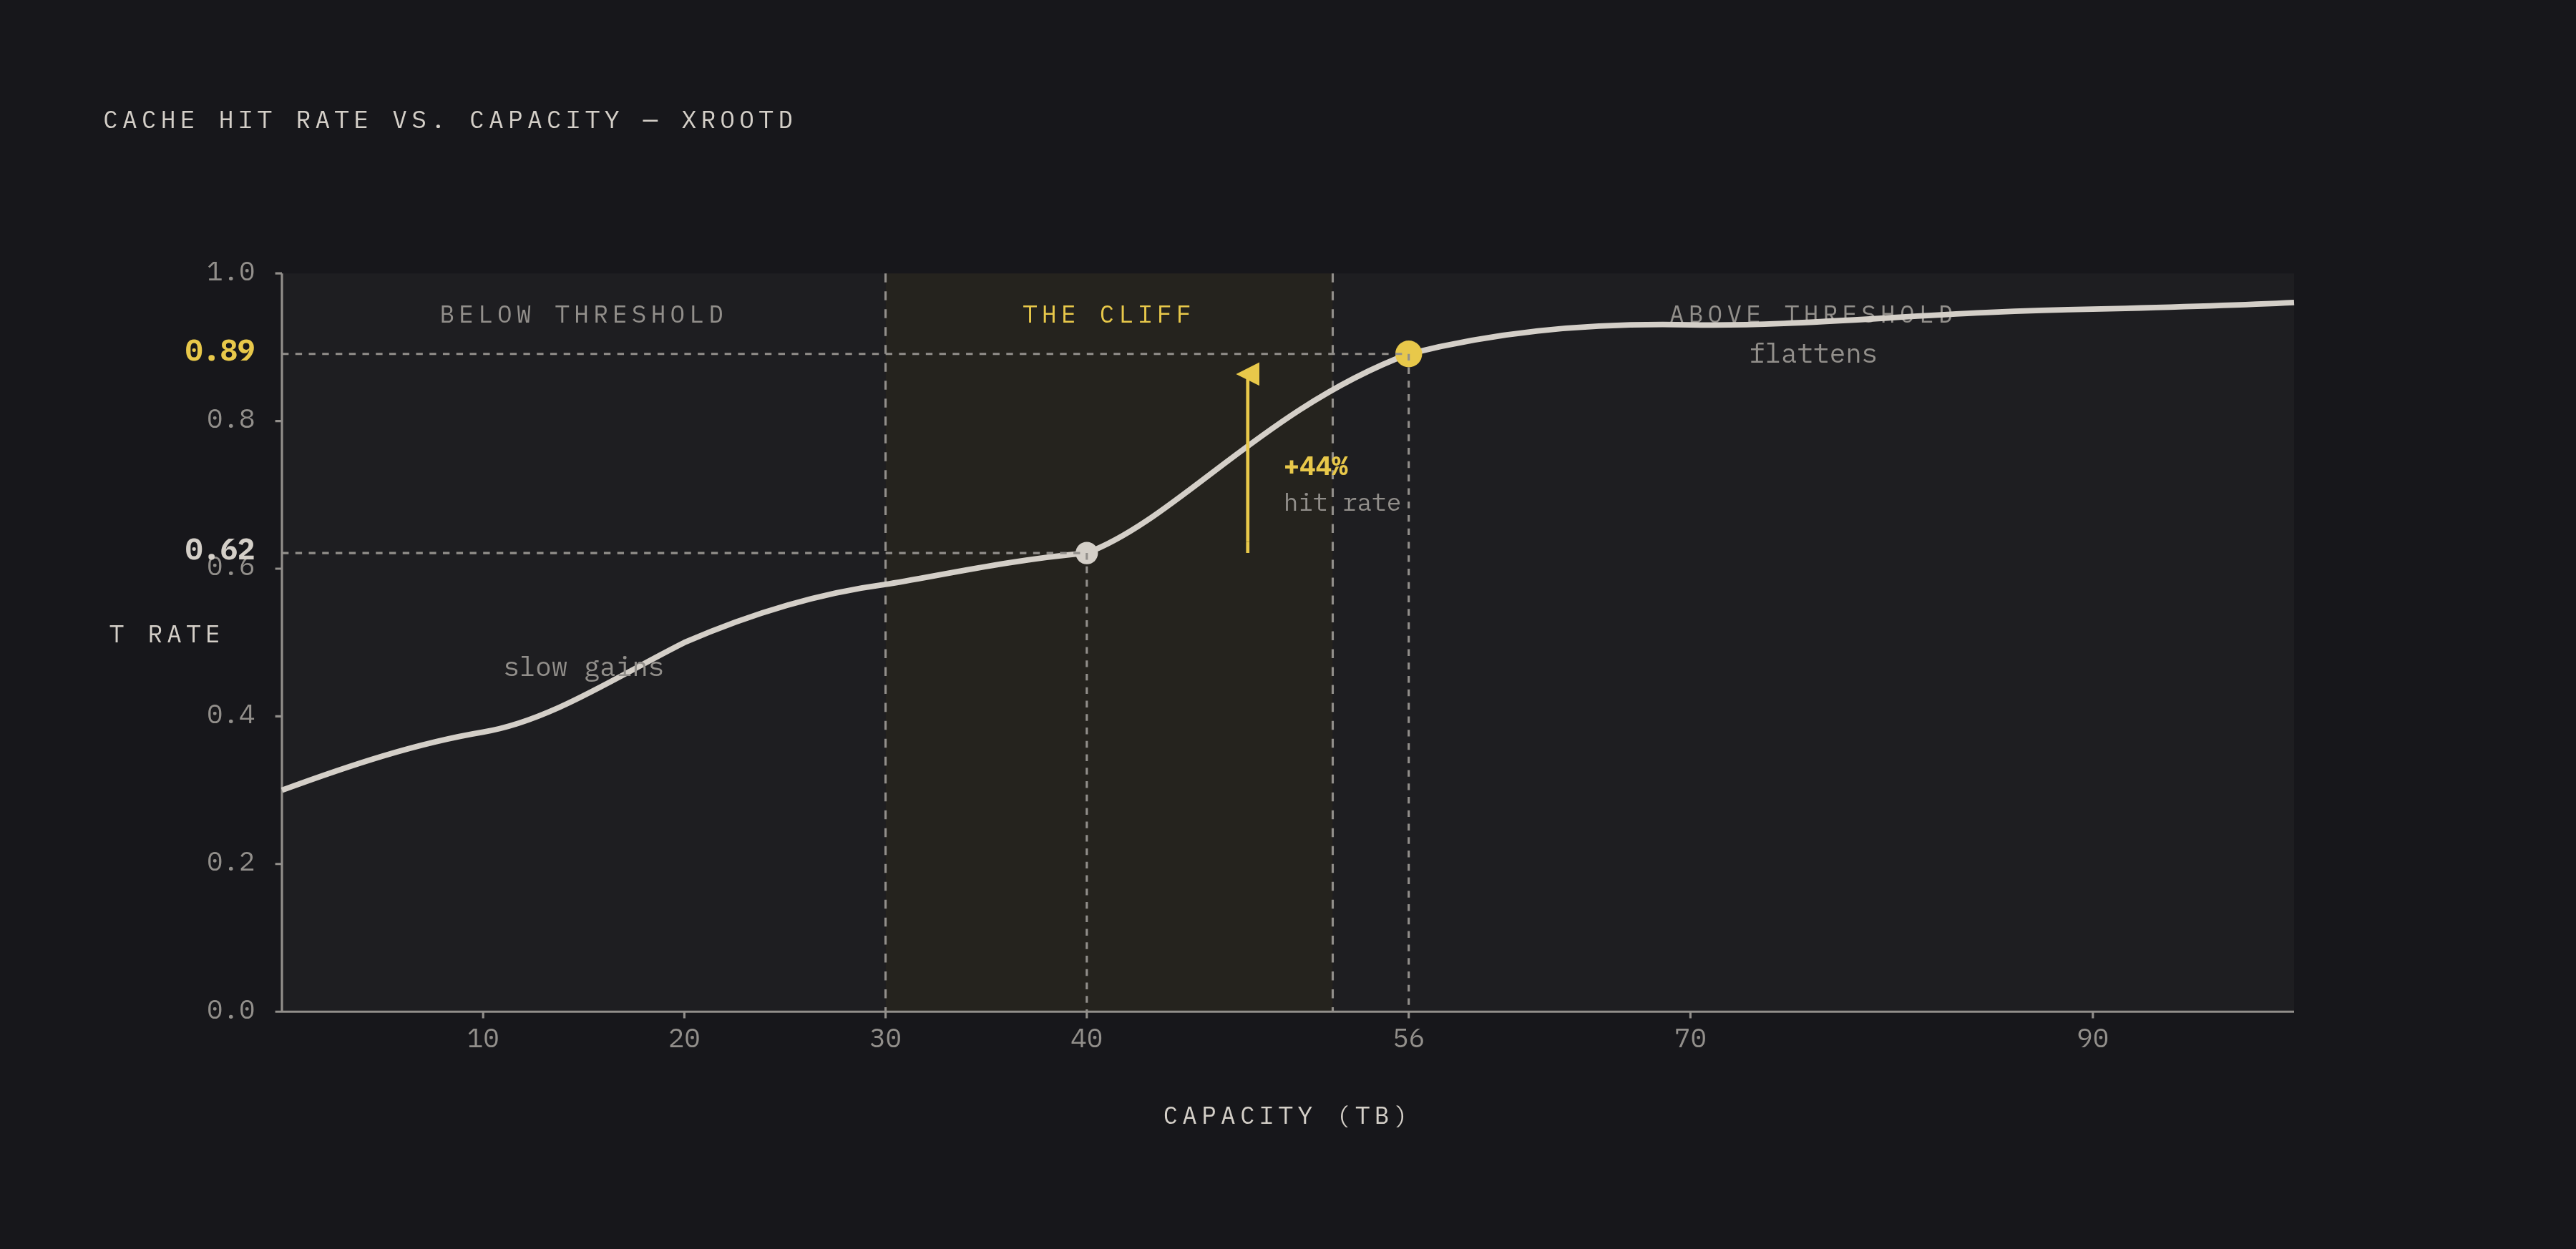
The XRootD research gives the cleanest illustration available. Through simulation, expanding the cache from 40 terabytes to 56 terabytes moved the hit rate from 0.62 to 0.89. That's a modest increase in capacity producing a large jump in hit rate, because the expansion crossed the exact threshold where the working set finally fit.
That nonlinearity is the real lesson. Below the threshold, adding capacity barely moves the needle because you're still missing on data the cache was never big enough to hold. But if you cross the threshold, hit rate jumps fast, because the cache now covers nearly everything actively in use. If you keep adding capacity past that point, the gains flatten out again, because you're now caching data nobody's asking for. Provisioning by guesswork, without profiling or simulating the working set first, means landing anywhere on that curve by accident, including the flat parts on either side of the cliff.
AI training workloads make this harder to pin down than a physics dataset. Shuffle order changes between epochs. The same data gets revisited across multiple epochs in different sequences. Multi-modal datasets mix formats with wildly different access costs. The working set shifts run to run, and sizing a cache off total dataset size alone, instead of actual working set behavior, tends to either overshoot the budget or undershoot the threshold.
Why eviction policy choice matters when the working set doesn't fit
Once the working set is bigger than the cache, something has to decide what stays and what gets thrown out, and that decision is eviction policy. It can't lift the ceiling that capacity sets. It determines how close to that ceiling the system actually gets.
Classic policies carry assumptions that don't hold up well against AI workloads. Least Recently Used, or LRU, assumes the most recently touched data is the most likely to be needed again soon. That assumption breaks during sequential scans and single-pass training loops, where genuinely hot data gets evicted simply because something newer passed through more recently, even though the older data will be needed again next epoch.
A block of cached key-value data can rack up a high access count during one long session, then go untouched once that session ends. Frequency alone can't tell you whether data is hot because it's genuinely reused or hot because it happened to get hammered once before disappearing for good. Lifespan carries as much signal as frequency, and LFU simply doesn't track it.
One practical middle ground is adaptive policy switching: pluggable eviction frameworks that watch hit ratio over a sliding window and dynamically pick among LRU, LRFU, LIRS, and ARC depending on which one is winning right now for the current access pattern. So you get a realistic bridge between hand-picked classical policies and anything built on machine learning. On the ML side, surveyed approaches apply models like XGBoost, decision trees, and logistic regression to predict what to evict, pulling in signals like object size, access time distribution, and session lifetime that classical policies never look at. That's worth knowing exists. It's not the decision most teams need to make today.
The decision most teams need to make today has a production answer behind it. A workload-aware eviction policy evaluated on real production traces measurably improved cache hits over workload-agnostic LRU and LFU, and delivered a substantial improvement in mean response time alongside it, in a vLLM serving setting. Match the policy to how your actual workload behaves; for KV cache workloads specifically, that means a policy that understands session lifetime.
How the structure of data flowing into the cache shapes hit rate
The shape of the data arriving at the cache decides hit rate before a single eviction decision ever runs. Format and access pattern determine how many distinct objects the system has to track and how predictable their reuse looks, and no policy can fix a structure that was broken upstream.
Training data format makes this concrete. Store a training dataset as millions of individual JPEG files and every epoch generates millions of metadata lookups before a single byte of image data even reaches the cache, burying the storage layer in overhead that has nothing to do with the actual content being served. Repackage that same dataset as WebDataset shards, each one holding roughly a thousand images, and metadata operations drop by three orders of magnitude. The effect is big enough that a modest NFS server serving the sharded format can outperform a high-end NAS serving the original one-file-per-image layout. Same data, same hardware budget, but the cache behaves completely differently, purely because of how the files were packaged.
LLM inference runs into the same principle from a different direction. ProjectDiscovery's security agent, Neo, runs many LLM steps per task against a very long system prompt, and at first its cache hit rate was very low. The cause was dynamic working memory sitting embedded inside that system prompt, so the supposedly stable, cacheable prefix changed on nearly every step, and it invalidated the cache almost immediately each time. Moving that dynamic data out of the prefix raised the hit rate dramatically and cut LLM cost substantially, with billions of tokens eventually served straight from cache. Manus ran a similar refinement: it analyzed real request traces and moved cache breakpoints to line up with stable prefix boundaries, and that raised its cache hit rate on OpenAI models from an already-high baseline to something consistently higher still.
Different domains, same underlying rule: anything that mutates inside what's supposed to be a stable cache key, whether that's a file path, a prefix hash, or a request header, collapses hit rate no matter how large the cache is or how smart the eviction policy behind it happens to be.
Prefetching as a way to convert miss penalty into hidden latency
Eviction decides what to keep. Prefetching decides what to fetch before anyone's asked for it, pulling data from a slower tier based on a prediction, so that by the time the application actually requests it, the answer's already sitting in cache. Done well, it turns a miss penalty into latency nobody notices. Done carelessly, it does the opposite.
Predictions get built from sequential access history, from correlations in access timing, or from models trained to guess next-access time. AI training workloads tend to reward this. Epoch-based access over a shuffled but bounded dataset is predictable enough, across repeated epochs, that something like PyTorch's DataLoader prefetch buffer can stay a step ahead of the GPU reliably.
Irregular workloads punish the exact same strategy. If access is random across a large, cold dataset, or an agent task branches unpredictably step to step, a prefetcher has nothing reliable to predict from. If you guess wrong under those conditions, the prefetched data doesn't just fail to help, it shoves genuinely hot data out of the cache to make room for something nobody needed. So if access patterns are unpredictable, aggressive prefetching actively makes hit rate worse, not better.
KV cache inference shows what prefetch looks like when it's built for the job from the start. A proposal called ObjectCache tackles inference prefetch specifically, by designing the storage protocol and the transfer schedule together so the server hands over KV cache data in exactly the order the GPU is going to consume it. Do it that way, and the overhead stays marginal even against local DRAM, on long context windows where getting the order wrong would cost you.
The practical rule: calibrate prefetch aggressiveness to the workload, don't apply one setting everywhere. Training runs with known, repeatable data order can run prefetch hard. Agentic workloads with branching, unpredictable paths should lean conservative or stick to fetching only on demand.
KV cache in LLM inference as the highest-stakes instance of tiered storage hit rate optimization
The gap between storage throughput and compute speed shows up in dollars most clearly in KV cache for LLM inference. A cache miss here doesn't just add latency, it forces the GPU to recompute attention states from scratch instead of retrieving something already worked out, and that recompute cost is now priced directly into how inference providers bill for tokens.
KV cache is, at its core, a way of trading storage for compute. When hit rate is high, the GPU pulls previously computed attention states back from storage instead of running the math again, and the throughput of whatever tier is holding that cache directly sets both latency and cost for the request. A miss forces the GPU to redo work it already did once.
Reuse patterns in production aren't random. Observations from a large cloud provider show single-turn and multi-turn requests contributing comparably to overall reuse, and for one specific request category the pattern is predictable enough that a workload-aware eviction policy can be built to target that segment specifically.
The architecture for handling this at scale now has a name and a shape. LMCache spreads KV cache across CPU memory, local disk, remote disk, and Redis, and shows throughput improvements over baseline approaches at multiple QPS levels. A broader pattern seen across large-scale training clusters uses S3 for durable dataset and checkpoint storage, NVMe for local scratch space (largely through DeepSpeed's ZeRO-Infinity), and GPU memory for whatever's actively being computed on, though that exact three-tier combination isn't a single shared, confirmed configuration across PyTorch FSDP, DeepSpeed, and Ray Train individually.
A joint deployment from DDN and Google Cloud's Managed Lustre, from April 2026, showed what offloading KV cache to a fast shared tier can do in practice: mean time to first token dropped measurably compared to keeping everything in host memory alone, with TPU utilization reaching high levels for the customers running on it. Recompute costs a lot, storage throughput sets the bill, and KV cache hit rate is the number that sits on top of both.