Latency Tail Percentiles in Cloud Storage Under Concurrent Agent Load
P99 latency matters more than averages when agents hit storage concurrently.
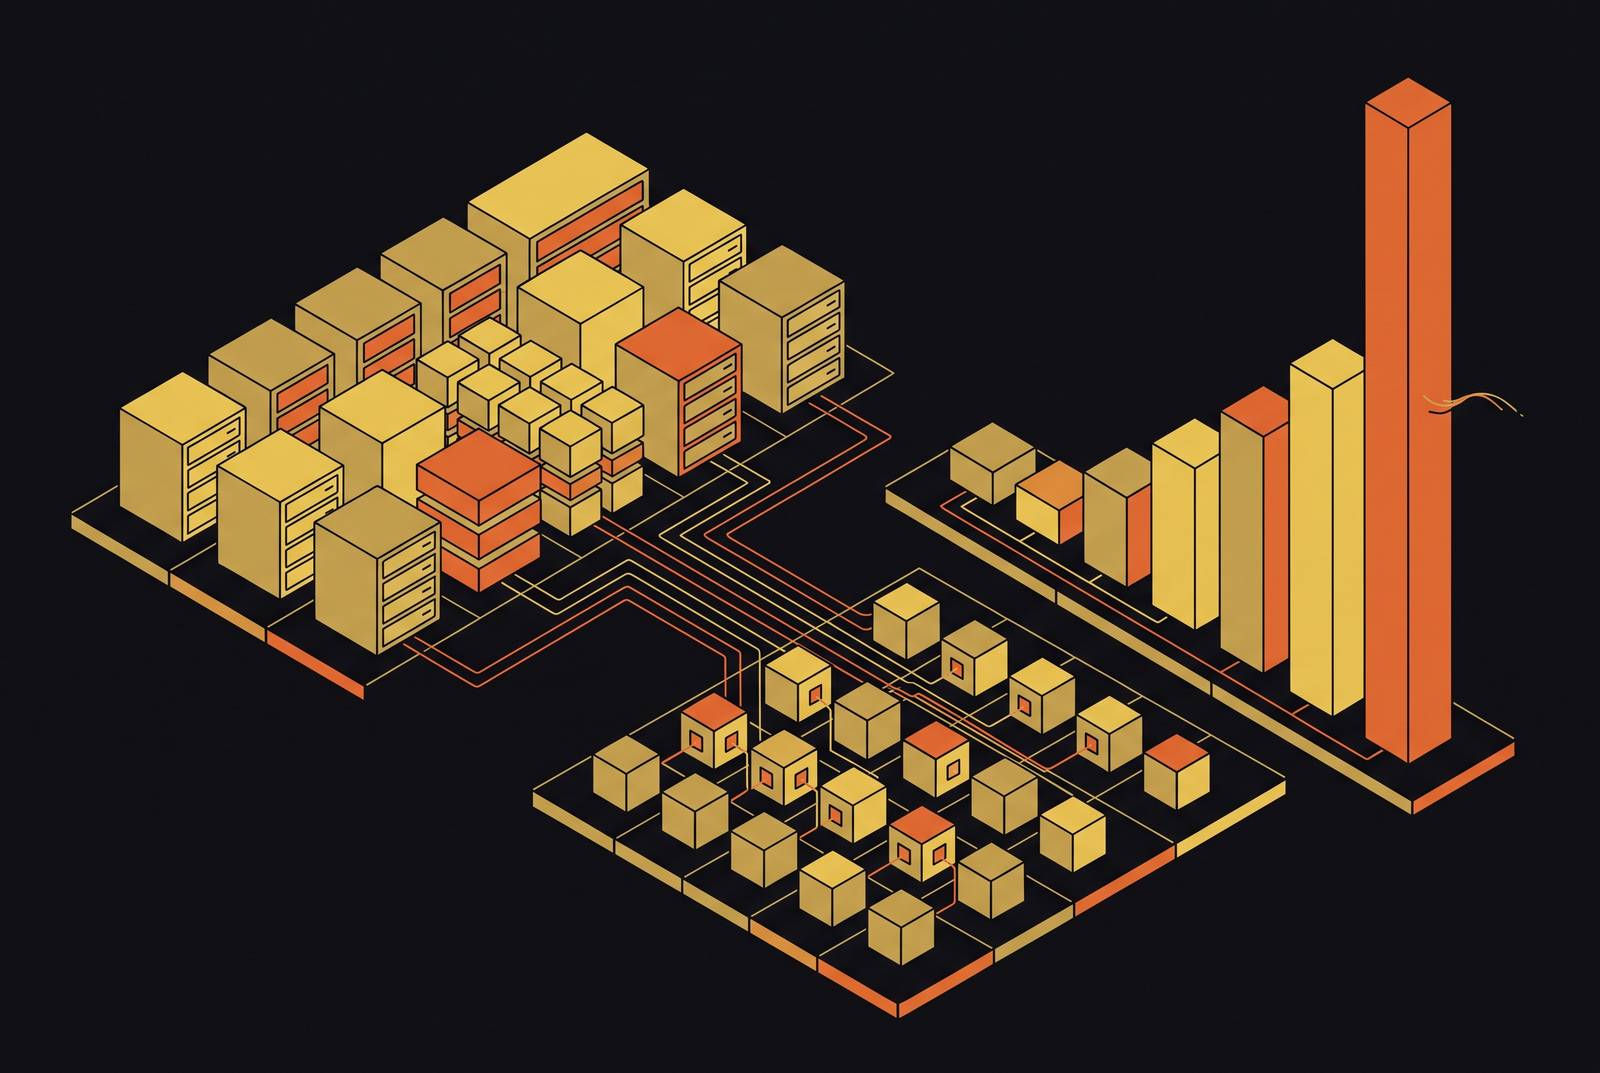
P99 latency, the response time that's slower than almost all requests, is the measurement that actually tells you whether a storage system is going to embarrass you in production. Averages and medians can't do that job. An average can look perfectly respectable, but a meaningful slice of requests can still crawl in minutes behind everyone else, because averages get pulled around by outliers until the number stops describing any request that actually happened. Nobody experiences the average. Somebody experiences the slow one.
P99 is defined as the worst-case latency under normal operating conditions, and it sets aside the truly freak events. Max latency gets dominated by one-off anomalies (a cosmic ray hits the data center, who knows), and p90 or p95 don't dig deep enough into the tail to catch the failures that matter. P99 sits in the sweet spot: common enough to represent a real operational pattern, rare enough to represent the genuine edge of what your system can handle.
The practical stakes are blunt. SLA violations live in the tail. A storage system can post a gorgeous median and still rack up penalties and lose customers, because the business impact comes from the slow tail, not the fast majority. P99 also serves as a diagnostic: a p99 that stays stubbornly elevated over time is telling you there's a structural problem baked into the architecture, not a weird Tuesday.
All of this gets more urgent once requests stop showing up one at a time. A single slow request is a nuisance. A storage system fielding dozens of simultaneous requests from parallel processes is a different animal entirely, and that's where the real trouble starts.
Fan-Out From Parallel Agents
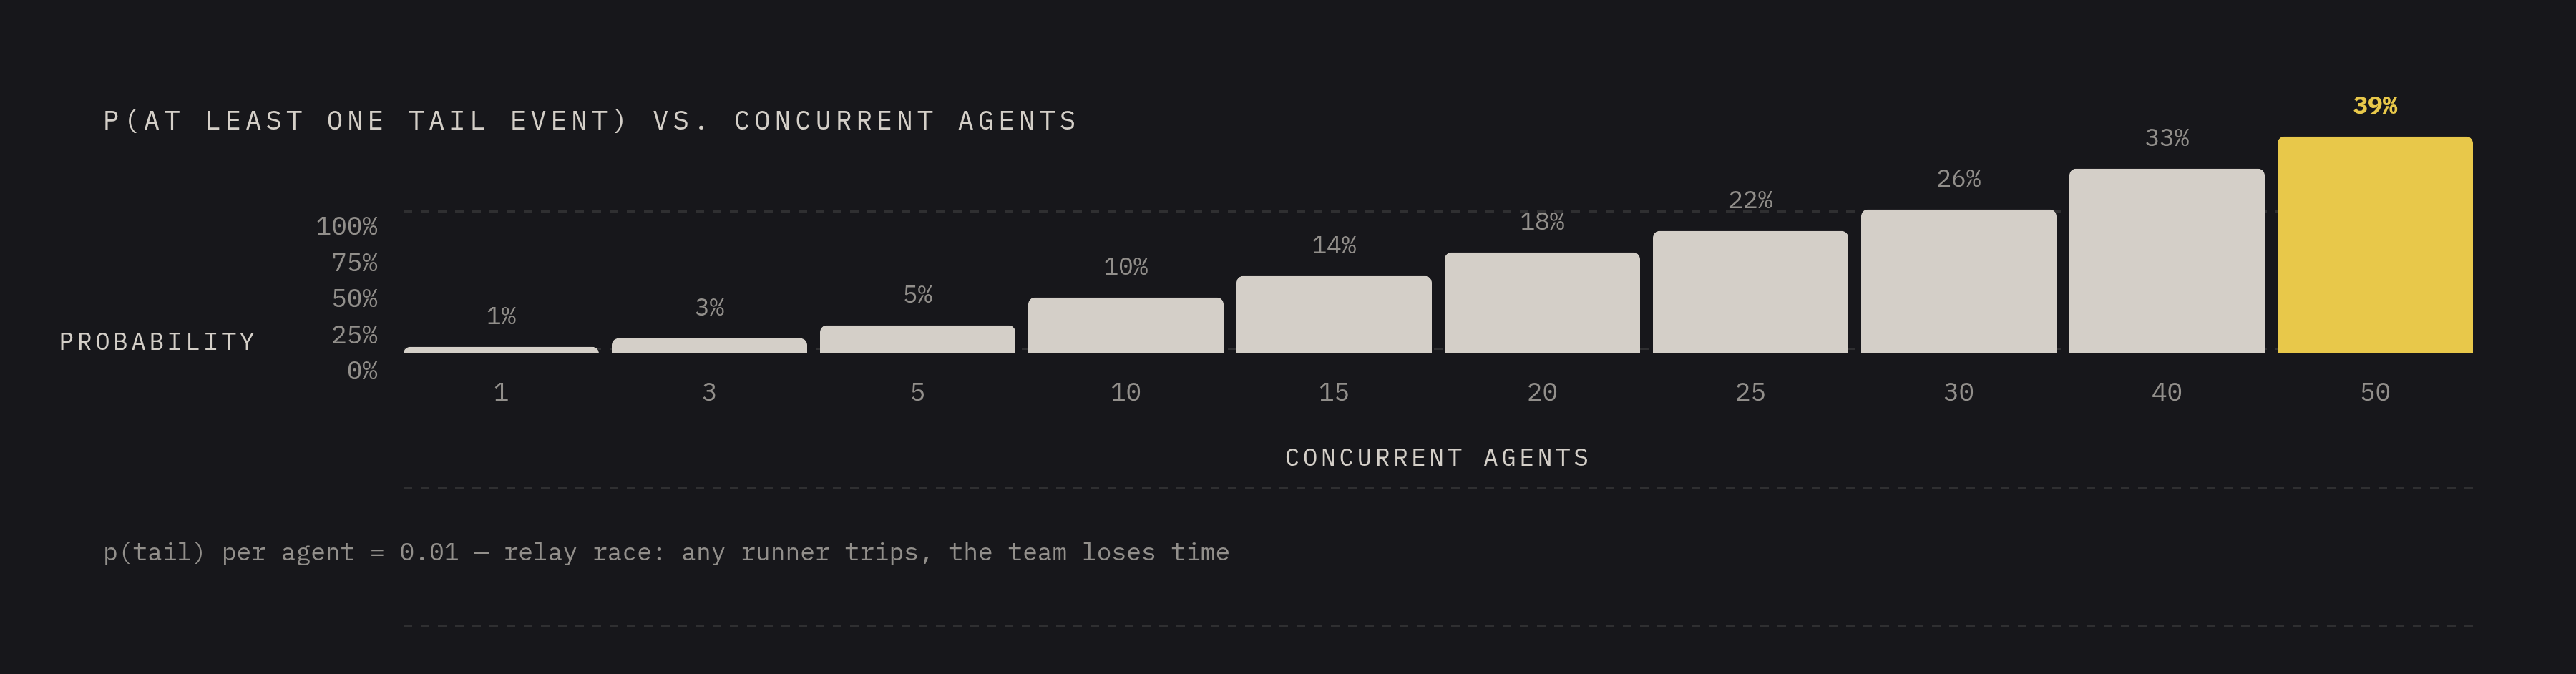
Picture a relay race where every runner has a small chance of tripping. With one runner, that's a small chance the team finishes slow. With fifty runners, somebody's going down, and it's basically guaranteed. That's fan-out, and it's the mechanism by which parallel AI agents turn an unremarkable p99 into a system-wide failure.
Any distributed system that assembles a result from multiple components is only as fast as its slowest piece. If a workflow depends on ten calls happening in sequence or parallel, the overall response time is governed by whichever call lands in the tail, and the math only gets harder from there: to keep the system-level p99 respectable, each individual component actually needs a better percentile than the system as a whole requires. The more moving parts, the stricter that requirement gets.
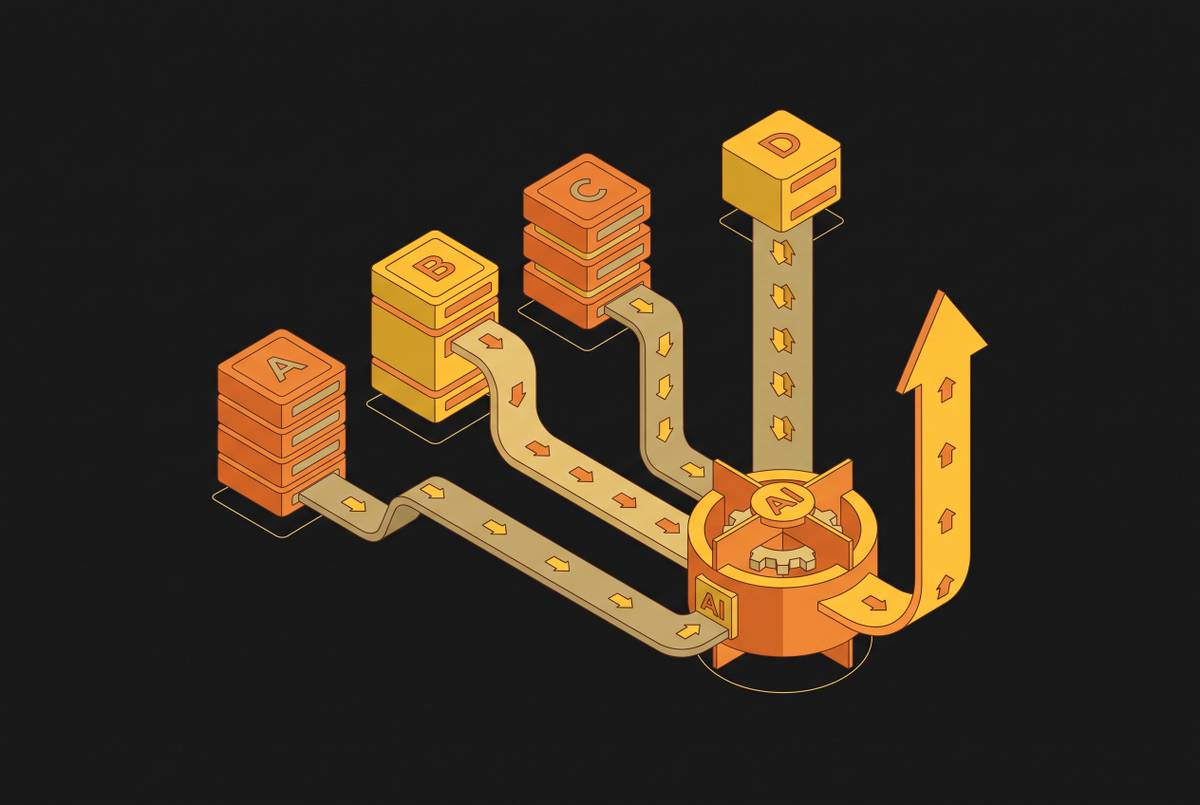
Agentic systems push this further than standard microservices ever did. A single orchestrating agent can spin up subagents, each one reading from and writing to shared storage, and that multiplies the number of latency draws happening on every operation. It's dozens of chances of hitting the tail, happening concurrently, on every single turn. The effect compounds rather than adds: each additional subagent introduces another independent shot at a tail event, so the end-to-end p99 of the whole composed operation degrades faster than the p99 of any single call within it.
Benchmarking research on serverless orchestration backs this up at the platform level. ServiBench's study of serverless applications found that median end-to-end latency is frequently dominated not by the actual function computation, but by external service calls, orchestration overhead, and trigger-based coordination. The compute tier isn't usually the bottleneck. The storage tier is.
That leaves a specific trap for teams building agent infrastructure: a storage system with a perfectly fine p99 in isolation can still produce unacceptable end-to-end latency the moment several agents start drawing on it at once, simply because the odds of at least one call landing in the tail, on any given turn, climb toward certainty.
Causes of Storage Tail Latency Spikes
Tail latency doesn't come from nowhere. It traces back to a short list of identifiable mechanisms rooted in how shared infrastructure actually behaves, and knowing the list is what makes the problem solvable instead of mysterious.
Multi-tenancy is the first lever. When CPU cores, network interfaces, or storage devices get shared across tenants, interference occurs occasionally rather than constantly, so a workload that behaves consistently on its own can still get knocked around by a neighboring tenant's burst of activity it has no visibility into and no control over.
Queue saturation is the second. When concurrent I/O requests outpace what the storage backend can actually process in parallel, requests start queuing, and tail latency climbs. The relationship between queue depth and latency isn't gentle. At high concurrency, latency outliers can run orders of magnitude above the median, turning a system that looked fine under light load into one that buckles the moment real traffic arrives.
Research on control-theoretic I/O regulation in shared HPC environments, from Qarnot Computing and partner institutions, finds that storage congestion in shared environments produces unpredictable performance, causing slowdowns and timeouts, and that unpredictability is often more damaging than a lower but stable throughput ceiling would be. You can plan around a system that's reliably mediocre far more easily than one that's occasionally catastrophic. The same research notes that the traditional playbook, tuning the I/O stack for peak performance, is workload-specific, so it demands deep expertise that doesn't transfer. If tuning helps one tenant's access pattern, it can make another tenant's tail latency worse.
Object storage adds its own structural wrinkle. It's built for large sequential reads, not random access under heavy concurrency. Put it in a hot path without a caching layer in front of it, and tail latency becomes a function of round-trip network time plus whatever queuing happens at the object-store endpoint, with nothing local to absorb a spike.
Write-ahead logging workloads make the cost concrete. The BtrLog research, from TU München, TU Darmstadt, and TigerBeetle, describes remote block storage like EBS as adding substantial write latency compared to local SSDs, and standard object storage like S3 as impractical for latency-sensitive append operations because of per-append cost and round-trip time. Tail latency runs high there before any contention even enters the picture. BtrLog's answer, replicating log records across a quorum of SSD-backed log nodes in a single network round trip, exists specifically to cut sensitivity to stragglers in commit latency. The underlying lesson travels well beyond logging: where data physically lives determines the shape of the tail, not just the average.
Why inference workloads are more exposed to tail latency than training workloads
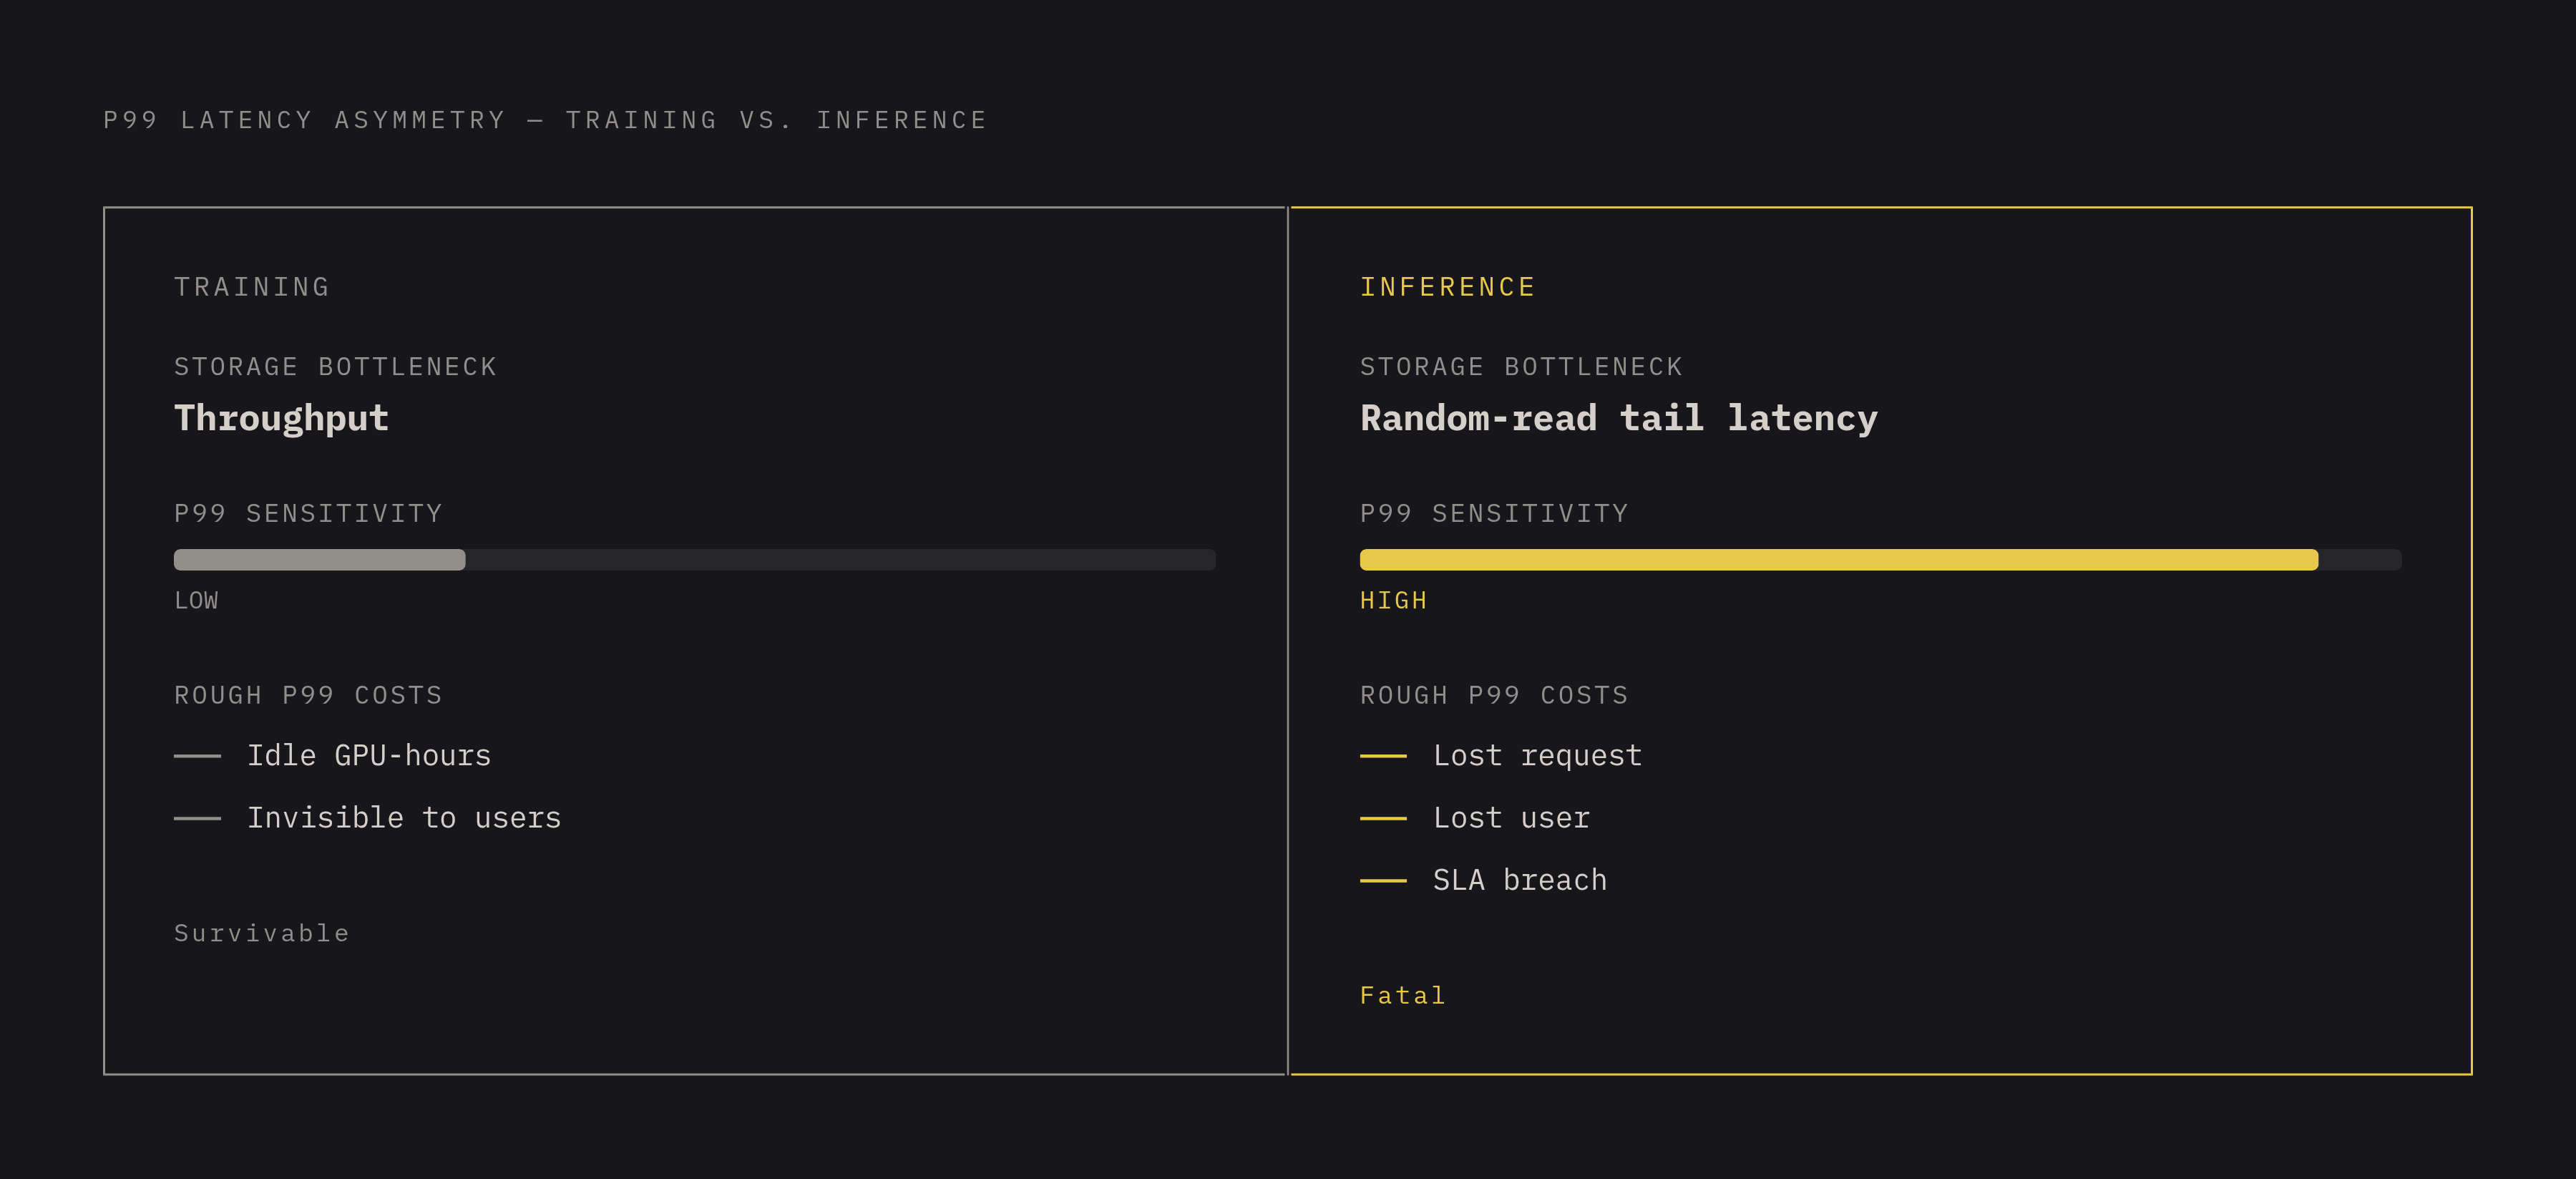
Training and inference ask storage for two completely different things, and that difference decides whether a sluggish p99 is a shrug or a five-alarm fire<sup>1</sup><sup>2</sup><sup>3</sup><sup>4</sup><sup>5</sup><sup>6</sup><sup>7</sup><sup>8</sup>.
Training wants throughput, not speed. It reads large sequential chunks at high bandwidth to keep GPUs fed, and a few seconds of latency barely registers as long as the aggregate bandwidth holds up. When storage becomes the bottleneck during training, it costs idle GPU cycles, expensive but invisible to any user.
Inference flips the equation. Serving a single request means pulling embeddings, session state, KV cache entries, or user context on demand, in response to one query at a time. What matters is random-access read latency at the tail, under concurrent load, not aggregate throughput across a batch job. Time-to-first-token budgets are set at the p95 and p99 level, which means any storage system sitting in that hot path has to stay inside the window on nearly every call, not just on a good day.
KV cache tiering shows the constraint in action. Most tiering systems treat object storage purely as a cold-rewarming archive, because the decode hot path can't tolerate round-trip latency to object storage mid-request. Newer designs work around this by running fetches concurrently with attention computation, keeping per-layer fetch time under per-layer compute time so the latency never surfaces to the user.
Training over millions of small files, as in computer vision, turns the bottleneck into a metadata lookup problem, a failure mode that throughput metrics don't capture. Bandwidth isn't the constraint there. The time spent locating and opening individual files at high concurrency is, and a storage system optimized purely for sequential read speed does nothing to fix it.
A training job with a rough p99 loses some GPU-hours. An inference service with a rough p99 loses the request, the user, and possibly the SLA.
Shared-Storage Congestion Control
One way to stabilize tail latency without tuning every workload by hand is to regulate I/O rates dynamically, using real-time signals of how congested the system actually is. That's the approach Collignon and colleagues at Qarnot Computing built and tested, and it offers a genuinely practical answer to a problem that otherwise seems to demand bespoke tuning for every tenant on a shared system.
The design uses a proportional-integral feedback controller, the same category of control loop that keeps a thermostat from overshooting, but here it adjusts client-side I/O rates based on observed system load. The approach reduced total runtime by up to 20% and lowered tail latency while keeping performance stable.
The feature that makes this approach useful for multi-agent systems specifically is what the controller doesn't need to know. It doesn't require advance knowledge of each application's I/O patterns. It responds to the signal of congestion itself, so it applies across wildly different workloads sharing the same storage infrastructure, and you don't need per-tenant profiling. For a storage layer serving dozens of agents with unpredictable, constantly shifting access patterns, that's about the only kind of mitigation that scales.
This is a coarse-grained, client-side mechanism. It reduces pressure on the shared backend, but it doesn't eliminate multi-tenant interference at the source. It stabilizes the system rather than removing the noisy neighbor. The authors chose this deliberately: in shared HPC environments, preventing performance degradation from congestion can matter more than maximizing peak I/O for any one application. That framing maps directly onto multi-agent deployments sharing a storage tier, where no single agent's peak throughput matters as much as the whole system staying predictable while everyone runs at once.
The broader lesson generalizes past this one piece of research. Feedback built into the I/O path handles concurrent-agent load more robustly than static provisioning does, because nobody can predict in advance how many agents will be hammering the storage layer at a given moment. Provisioning for a guess is a bet. Responding to the actual signal is engineering.
What network fabric and caching layer choices do to tail latency at the storage access path
Tail latency is decided by the entire path data has to travel to get there, and the network fabric plus the caching layer set hard limits that no clever storage design can get around.
Empirical work on the AIR Data Centre architecture, from Pinelo and colleagues, found that network bandwidth is the dominant constraint on storage throughput for bulk Earth observation data access, but only up to a threshold. Below that threshold, the network is the ceiling, full stop, regardless of how good the storage behind it is.
Above that threshold, specifically above 10 Gbps per server in Pinelo et al.'s evaluation, the constraint changes character. Endpoint memory topology, not raw network capacity, starts governing how much bandwidth a system can actually use. Pour more bandwidth into a network without provisioning the memory at the endpoint to match it, and the returns diminish fast. More pipe doesn't help if the endpoint can't hold the water.
Caching is where this turns into an architecture decision with real consequences for agent workloads. A local NVMe cache that intercepts reads before they reach object storage swaps a tail latency governed by multi-millisecond object-store round trips for one governed by sub-millisecond local SSD access. For concurrent agents hammering a shared storage layer, that's the gap between a p99 that holds and one that doesn't.
Cache misses under concurrency carry their own hazard. When many agents miss at the same moment, say during a cold start or a sudden shift in workload, they all fan out to object storage simultaneously, creating a burst of concurrent requests that can saturate the object-store endpoint. The resulting tail latency runs far worse than what any single miss would produce on its own. One miss is an inconvenience. A synchronized swarm of misses is an outage.
The write path deserves the same scrutiny. Flushing to object storage asynchronously, while replicating synchronously to local durable nodes before returning a success, keeps write tail latency off the critical path. The BtrLog architecture builds on exactly this principle: it archives to object storage asynchronously while replicating across SSD-backed nodes for durability on the fast path, so the slow, far-away write never gets to hold up the response.
Storage Architecture Attributes for Predictable p99 Latency
You don't get a predictable p99 under concurrent agent load just by optimizing one layer particularly well. It comes from a coordinated set of design choices spanning caching, the write path, concurrency handling, and interface semantics, each closing off one of the failure modes described above.
The cache has to absorb reads before they ever reach object storage. Sub-millisecond NVMe cache hits keep p99 stable no matter how much the object store's round-trip time varies, and of everything on this list, this is the single highest-leverage decision for inference and agent workloads specifically, because it's the one most directly tied to the random-access read pattern those workloads actually generate.
Writes need to be durable before they return success, but the flush to object storage can't sit on the critical path. Synchronous replication to local durable storage, followed by an asynchronous flush, eliminates the write tail latency spikes that object-store variability would otherwise cause. It's the same principle the BtrLog research validated for logging specifically, generalized here to the broader agent storage layer.
The interface matters as much as the data path. Agents running bash commands and file manipulation tools against a storage layer are going to exercise atomic rename, file locking, mmap, and fsync, and a storage system needs full POSIX semantics to support that without forcing workarounds. Incomplete semantics don't just create friction. They introduce their own latency variance, because every workaround is another opportunity for something to queue, retry, or block.
Elasticity in cache capacity matters just as much, because agent workloads don't have predictable working set sizes. An agent whose context balloons from one megabyte to one gigabyte mid-session needs headroom; a hard ceiling forces evictions and drags tail latency back toward object-store speeds right when the workload is at its most demanding.
The storage layer should treat the underlying object store as interchangeable. Teams running workloads across S3, GCS, Azure Blob, and R2 shouldn't need separate data movement pipelines or format-conversion steps for each one, since every extra pipeline is another place for latency variance to creep into the system. A cache and a POSIX interface that mount any bucket the same way removes that entire category of risk.
None of this is verifiable in a demo. It is visible under benchmarking discipline: testing inference infrastructure on p99 under real concurrent load, not average latency measured in isolation, while also watching cold-start behavior and noisy-neighbor isolation specifically. That's the difference between a system that looks good in a slide deck and one that actually holds its SLA once real agents, in real numbers, start hitting it at once.
Sources
- Design and Empirical Evaluation of a Network-Centric, On-Premises Architecture for Earth Observation Data Access
- BtrLog: Low-Latency Logging for Cloud Database Systems
- Let's Trace It: Fine-Grained Serverless Benchmarking using Synchronous and Asynchronous Orchestrated Applications
- Mitigating Shared Storage Congestion Using Control Theory